
By Nina Kamath ’16
Kelly J. Fredericks, newly-appointed Chief Executive Officer of the Ontario International Airport Authority (OIAA), is optimistic that Ontario can return to its peak from nearly a decade ago. “The three things I continually think of is that Ontario is under-utilized, it’s under-served, but it really points to the word of transformation. That’s why I’m here,” said Fredericks recently.
Under-utilization is easy to see when examining passenger totals over the past decade. ONT’s two terminals are designed to handle an annual volume of 10 million passengers.
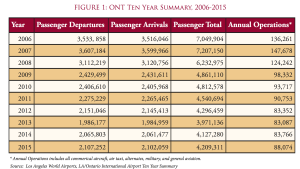
The total passenger volume at ONT, however, has never gotten that high. It reached a peak of 7.2 million in 2005 and hovered near 7 million for the next two years before dropping by 1 million in 2008 and another 1.3 million in 2009. The decline continued through 2013 when passenger volume was at 3.9 million. The last two years have seen modest gains, with 2015 volume inching up to 4.2 million, still 42% below 2007 levels.
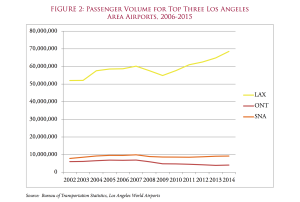
As shown in Figure 2, LAX passenger volume dipped slightly from 2007 to 2009, but subsequently took only two years to make up those losses. In comparison, ONT and John Wayne Airport, Orange County (SNA) have not yet been able to recover to the same level of passenger traffic. LAX had its highest traffic in 2015 with 74.9 million passengers, while performance for ONT and SNA are well under their 2007 peak of 7.2 million for ONT and 9.8 million for SNA. All three airports had their lowest traffic in different years. LAX dropped to 56.5 million passengers in 2009, but rebounded quickly. ONT experienced a drop in traffic every year from 2007 to 2013, when it hit bottom at 3.9 million passengers. SNA dropped every year from 2007 to 2011, although less dramatically than ONT. Passenger volume at SNA ranged in the past decade from a high of 9.8 million in 2007 to 8.5 million in 2011.
While JetBlue Airways chose ONT for its first West Coast flight in 2000, the airline suspended all flights at ONT in 2008. In fact, during the recession, many large legacy carriers such as American Airlines, United Airlines, and Delta Airlines lost substantial passenger volume in ONT as well.
ONT’s situation is not unique. An analysis of passenger trends of California’s second largest metropolitan region tells a similar story of steady increases for the main airport while the smaller airports in the region continue to struggle to regain their prerecession levels.
The Bay Area region is served by three major international airports. San Francisco International Airport (SFO), Oakland International Airport (OAK), and Norman Y. Mineta San Jose International Airport (SJC).
Among the three, SFO is the largest, touted as the ninth largest airport in the United States in terms of passenger volume and the twenty-fifth largest air cargo airport according to the Bureau of Transportation Statistics. SFO is also the second busiest airport in California after Los Angeles International Airport (LAX).
All three airports serve the broader region of the Bay Area, with SFO 13 miles south of downtown San Francisco, OAK 5 miles south of downtown Oakland, and SJC 2 miles northwest of downtown San Jose. The Bay Area has a population of 7 million people in nine counties, less than half the population of the Los Angeles region, 18.5 million.
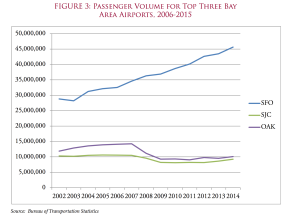
The Passenger Volume chart for the Bay Area airports looks remarkably similar to the Los Angeles Area chart discussed above. Like its counterpart in Southern California, SFO dominates the Bay Area market. It has more than four times the number of passengers for both domestic and international travel as SJC and OAK each. (Figure 3)
SFO passenger volume has steadily increased from 2002 to 2014, with its lowest traffic in 2003 at 28.2 million passengers and its highest traffic in 2014 with 45.6 million passengers.
On the other hand, SJC and OAK passenger volume has dropped after 2007 as with many mid-tier airports during the 2008 rise in oil prices and the recession. The peak of SJC and OAK were 2005 and 2007, when the airports had 10.6 million and 14.2 million passengers, respectively. Since the mid-2000s, both airports have experienced a decline in passenger volume, with a low point for SJC in 2010 at 8.1 million passengers and for OAK in 2011 at 9 million passengers. In fact, SJC lost three major East Coast flights in 2008 and lost 22% of its available seats from 2007 to 2009. OAK faced a similar decline after 2007 due to high fuel costs and airline bankruptcies.
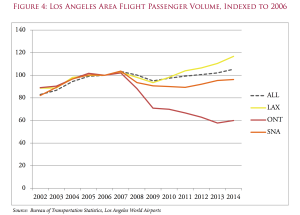
Figure 4 shows how each of the three airports in the Los Angeles market is doing compared to its performance in 2006. All the traffic numbers are indexed to 2006, meaning that performance for each year is compared to its 2006 passenger volume. The dotted line is the aggregate total for traffic at all three airports.
ONT is faring the worst with 2014 passenger volume at only 60% of its 2006 level. In contrast, LAX has recovered from its dip in passenger volume in 2009, 93% of its 2006 level of passenger traffic, and surpassed the general trend we observe in all airports. LAX has experienced a 16 point increase in traffic from its 2006 level by 2014. While SNA is faring better than ONT, it has still not gotten back to its 2006 level of passenger traffic. Overall passenger volume for the three airports is higher than before the recession, but the recovery is largely driven by gains at LAX.
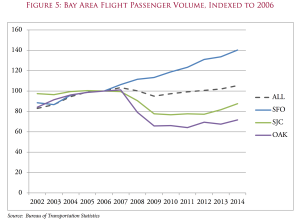
The Bay Area market reflects a similar picture. Figure 5 shows that the airport system as a whole has recovered after the recession and regained the lost passengers to its 2006 level, as evidenced from the slow uptick in passengers from 2012 onwards. By 2014, SJC and OAK experienced a 5 point increase in traffic from their low points in 2009 and 2011. In comparison, SFO has steadily improved on its 2006 level, while SJC and OAK have not yet completely recovered. While SFO has experienced a 40 point increase in 2014 from its 2006 level, SJC and OAK have declined by 13 points and 29 points, respectively.
From November 2014 to November 2015, the growth in passenger volume has reflected similar numbers across all three airports. SFO had a 5.32% increase in passengers. Similarly, SJC had a 3.95% increase. The two airport markets also have similar distribution with respect to the airlines operating at each of the three airports. An analysis of carrier shares shows that both LAX and SFO have reasonable balance across the major airlines and that Southwest Airlines dominates the smaller airports in both Southern California and the Bay Area.
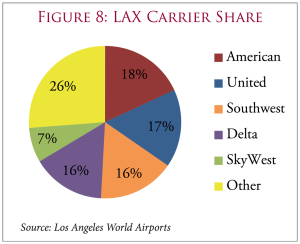
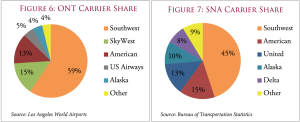
Figure 8 shows LAX is fairly evenly split among American Airlines, United Airlines, Southwest Airlines, and Delta Airlines with each of those carriers having between 16% and 18% shares. In contrast, ONT and SNA are dominated by Southwest, with 59% and 45% of each airport’s carrier share, respectively.
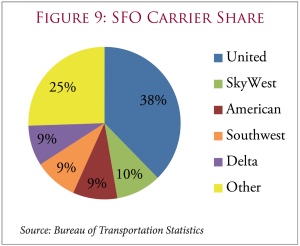
As shown in Figure 9, SFO carrier share is less balanced than LAX – it is dominated by United Airlines. SFO serves as the fifth largest hub for United Airlines, functioning as the airline’s primary trans-Pacific hub and sole maintenance hub. United Airlines comprises 38% of the airport’s carrier share, outpacing SkyWest Airlines, American Airlines, Southwest Airlines, and Delta Airlines, which each hover around 10% of the airport’s carrier share.
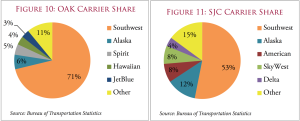
In contrast, OAK and SJC are dominated by Southwest Airlines, with 71% and 53% of each airport’s carrier share, respectively. For both of these airports, Alaska Airlines serves as the second largest carrier with a 6% and 12% share, respectively.
Sorry, comments are closed for this post.