
California continues to lose population, according to recent estimates by the California Department of Finance (DOF). After posting its first annual population loss in 2020 (down 182,083), the state lost another 117,552 in 2021. California’s population has now fallen to 39,185,605.
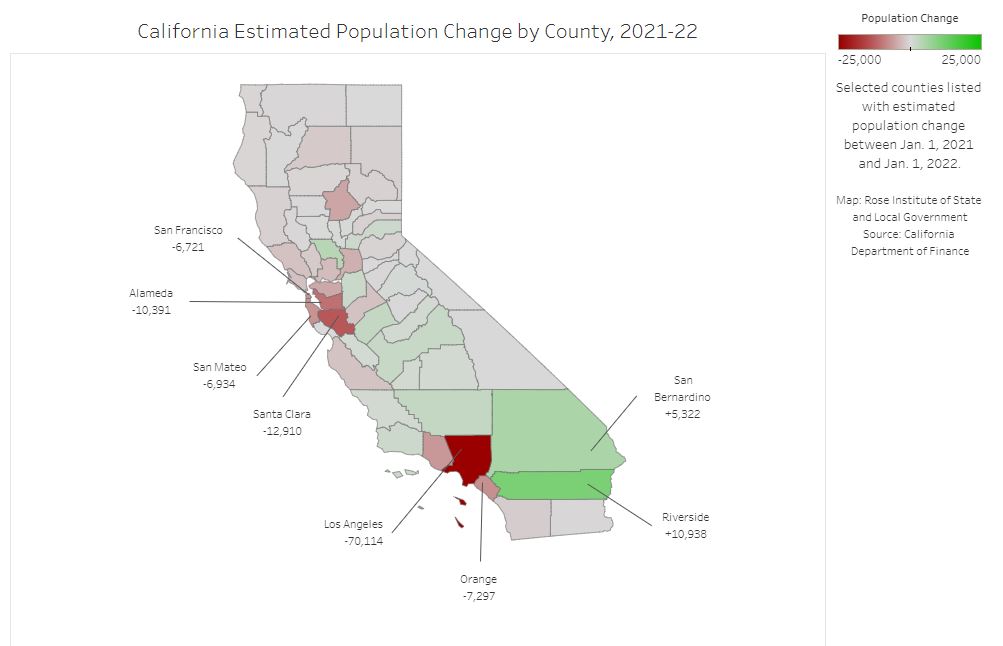
This map, produced by Rose Institute researcher Thomas Short using DOF data, shows that the population loss is concentrated in the state’s highly populated coastal areas (metro Los Angeles and the San Francisco Bay Area). Some rural and inland areas, including Riverside and San Bernardino Counties in the Inland Empire, saw modest population gains in 2021. This map highlights the top population losers and gainers, by county. (Click on the image to view the interactive map.)
| Top 10 CA Counties for Population Loss, 2021-22 | ||||
| County | 2021 Population | 2022 Population | Population Change, Absolute | Population Change, Percentage |
| Los Angeles | 9,931,338 | 9,861,224 | -70,114 | -0.71% |
| Santa Clara | 1,907,693 | 1,894,783 | -12,910 | -0.68% |
| Alameda | 1,662,370 | 1,651,979 | -10,391 | -0.63% |
| Orange | 3,169,542 | 3,162,245 | -7,297 | -0.23% |
| San Mateo | 751,596 | 744,662 | -6,934 | -0.92% |
| San Francisco | 849,475 | 842,754 | -6,721 | -0.79% |
| Ventura | 840,093 | 833,652 | -6,441 | -0.77% |
| Butte | 206,640 | 201,608 | -5,032 | -2.44% |
| Contra Costa | 1,161,324 | 1,156,555 | -4,769 | -0.41% |
| Sacramento | 1,580,624 | 1,576,618 | -4,006 | -0.25% |
| Top CA Counties for Population Gain, 2021-22 | ||||
| County | 2021 Population | 2022 Population | Population Change, Absolute | Population Change, Percentage |
| Riverside | 2,424,587 | 2,435,525 | 10,938 | 0.45% |
| San Bernardino | 2,182,343 | 2,187,665 | 5,322 | 0.24% |
| Yolo | 217,237 | 221,165 | 3,928 | 1.81% |
| Kern | 907,324 | 909,813 | 2,489 | 0.27% |
| Merced | 281,874 | 284,338 | 2,464 | 0.87% |
| Fresno | 1,009,231 | 1,011,273 | 2,042 | 0.20% |
| San Joaquin | 782,372 | 784,298 | 1,926 | 0.25% |
| Placer | 407,517 | 409,025 | 1,508 | 0.37% |
| Santa Barbara | 443,674 | 445,164 | 1,490 | 0.34% |
| Madera | 156,385 | 157,396 | 1,011 | 0.65% |
| Source: California Department of Finance | ||||
Sorry, comments are closed for this post.