
Download PDF
I. INTRODUCTION
City managers serve as chief executive officers in hundreds of cities across California, making them the state’s most important group of local government officials. Despite their importance, however, comparatively little study has been done of the men and women who fill these critical positions. What are the demographic characteristics of California’s city managers? What are their educational backgrounds? What were their work experiences before their appointments? And, what do they see as the most important issues facing their cities? To find initial answers to these questions, the California City Management Foundation (CCMF), joined by Tripepi Smith Talent Solutions and the California Joint Powers Insurance Authority, commissioned the Rose Institute of State and Local Government, an academic research institute at Claremont McKenna College, to survey the state’s city managers. This report presents the survey’s findings and offers a profile of the city management profession in California.
The city manager system dates back to the Progressive Era of the late nineteenth and early twentieth centuries. During this period, critics of municipal government such as Lincoln Steffens, author of The Shame of the Cities (1904), decried corruption and bossism in cities across the country, and organizations such as the National Municipal League (1894) were established to promote urban reform. The reformers argued that cities could be redeemed through the introduction of non-partisan, professional management.
Proponents of the professionalization movement emerged in many parts of the United States, with Californians exerting early leadership. A notable example was Haven H. Mason, a prominent city official in Santa Clara and later San Francisco, founder in 1898 of the League of California Municipalities (later known as the League of California Cities), and editor of the magazine California Municipalities. In an 1899 editorial in that journal, Mason advocated for a “distinct profession of municipal managers” that would have “sound business judgment” and apply “strict business principles.” Mason noted that city administration is a “business peculiar to itself” with “no other business concern like it in the commercial world.” As a result, he advocated that universities develop programs specially designed to prepare graduates “to enter the new profession of conducting municipal business.” Mason concluded that “[i]t would be an interesting experiment for a city to employ a professional manager, and it would very likely prove a successful experiment. Then ambitious young men would fit themselves for municipal employment and before long our cities would be managed by professional municipal officers instead of by professional politicians.”[1]
Over the next two decades, several cities pursued these experiments. In 1904, the small city of Ukiah, in Northern California, became what seems to have been the first city in the nation to hire a chief executive, selected by the city council, although the office was not called “manager.”[2] Other experiments followed in Staunton, Virginia (1908) and Sumter, South Carolina (1912). In 1914, Inglewood and Glendale became the first California cities to adopt the council-manager system, as it came to be known.[3] That same year, the City Manager Association (later the International City/County Management Association, or ICMA) was established, providing an organizational structure for the new profession. In 1915, the National Municipal League adopted the manager plan in its Model City Charter, giving the concept widespread legitimacy and appeal.[4]
Unlike in “strong mayor” cities where the mayor wields executive authority, in a council-manager system, the city manager acts as the chief executive and is charged with administering the full range of municipal operations. In council-manager cities, elected representatives (council and mayor) are expected to set policies and the city managers implement them, although managers often share responsibility for policy formation. The role of a city manager is complex and requires a broad range of skills. City managers are expected to possess a high degree of education and training and to adhere to a set of professional values, norms, ethical standards, and practices. In 1985, the California City Managers Foundation (CCMF) was founded in part to strengthen these professional norms and promote city management education.
California has embraced the council-manager form of municipal government more completely than the rest of the nation. In a 2016 study published by Common Cause, researcher Nicolas Heidorn found that 468 California cities (or 97 percent) used this system. Only five major cities in the state — Los Angeles, San Diego, San Francisco, Fresno, and Oakland — used a “strong mayor” or mayor-council system in which the elected mayor is the chief administrative officer, assisted by an appointed administrative official.[5] A few small cities in California have decentralized the administration of government, with department heads reporting directly to the city council or to individual council members.[6] As of 2018, California cities used the council-manager system at more than double the national rate. According to the ICMA 2018 Municipal Form of Government Survey, 48.2% of American cities (n = 4,020 cities) reported they used the council-manager form of government, compared with 38.2% that used the mayor-council system.[7]
“City manager” is the most common title used for the chief administrative officer in the vast majority of California cities. Of the 482 cities in this study, 431 use a city manager (we include the 417 current city managers, 11 interim city managers, two acting city managers, and one deputy city manager). “City administrator” is the next most common title (26 cities), followed by town manager (17 cities). With the exception of the five cities that have a strong mayor system of government, the city managers, city administrators, and town managers perform functionally equivalent jobs. For the balance of this report, we use the term “city manager” to include all of these positions.
Although the council-manager system has become the dominant form of municipal government in California, only limited research has focused on the state’s city managers as a group. One notable exception is the study of the status of women in the profession. ICMA has conducted research on the number and percentage of women chief administrative officers (including city managers and the highest-level county administrators) in California and across the nation. Those findings, presented in reports in 1976 and 2014 and in later updates, indicate that the number of women at the top level of local government management has increased over time, but that women remain underrepresented in those positions — 19% in the United States and 25% in California as of 2021.[8] This report seeks to supplement this and other research on city managers in California and provide a more robust profile of the profession.
II. SURVEY METHODOLOGY
The Rose Institute drafted the survey instrument in collaboration with CCMF and Tripepi Smith. See Appendix A. We collected survey data over the course of ten weeks beginning on Monday, January 10, 2023. We emailed a letter of introduction explaining the study to all city managers in California. The survey was conducted using Qualtrics software and took respondents less than five minutes to complete. Each week for the next five weeks we sent one follow-up email and made one phone call to each city that had not yet responded. This netted responses from a total of 321 cities, for a response rate of 67%. See Appendix B.
The research team supplemented the survey response data with information from publicly available sources such as city websites, newspaper articles, and LinkedIn. We gathered data on education, time in current position, prior position, major field of study, city council size and mode of election, and direct election of mayor. We were able to fill in data for many, but not all, of these variables for many, but not all, of the non-responding cities. We did not fill in data for age, gender, or race; the data in those tables derives from survey responses only.
The research team then checked the data for accuracy and consistency. We also coded responses for the Major Subject of Study and Most Pressing Issues. See Appendix C and Appendix D.
It is important to note that not every survey respondent answered every question. For example, 319 of the 321 respondents filled in the question on age, 318 of the 321 filled in the question on education, 312 of the 321 filled in the question on race or ethnicity, and 285 of the 321 filled in the question on prior government experience. Similarly, with respect to the non-responding cities, we were able to fill in data for a varying number of cities for each variable. The number of data points for each variable is noted under each table (N=__).
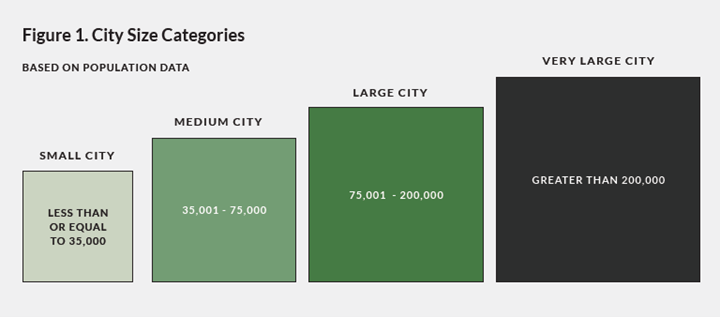
The research team also gathered population data for each city from the United States Census Bureau and coded the cities into four size categories (small, medium, large, and very large) for the purposes of this study. Assigning a size code to each city is a useful analytic tool to see how city manager characteristics differ for cities of varying sizes.
III. DEMOGRAPHIC PROFILE
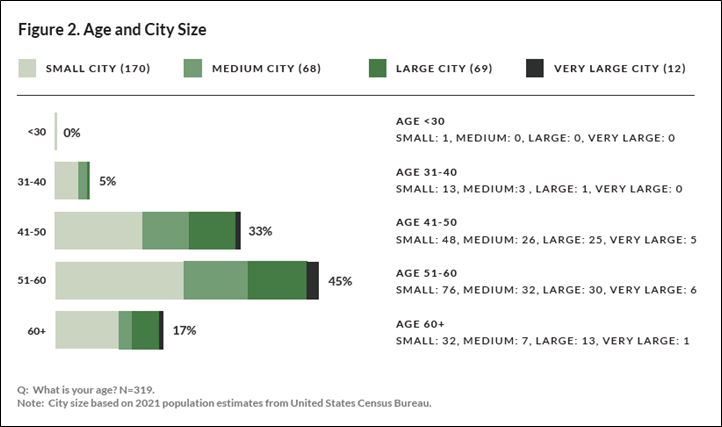
The vast majority of California city managers for whom we have age data are in their forties or fifties. Forty-five percent of respondents are aged 51-60 and another 33% are aged 41-50. Those who are younger mostly serve in Small or Medium Cities (17 of the 18 age less than 30 or 31-40). On the opposite end of the spectrum, managers in the 60+ age bracket also largely serve in Small or Medium Cities (39 of the 53 in that age group). Managers in Large Cities and Very Large Cities are largely in the 41-50 and 51-60 groups. Of the 69 managers of Large Cities, 25 are 41-50 and 30 are 51-60 years of age. Similarly, the 12 managers of Very Large Cities who answered this question are split with five 41-50 and six 51-60.
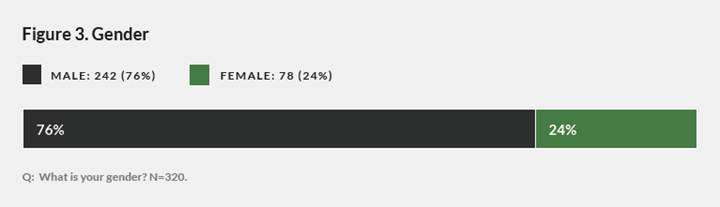
One-quarter of city managers responding to the survey are women and three-quarters are men.
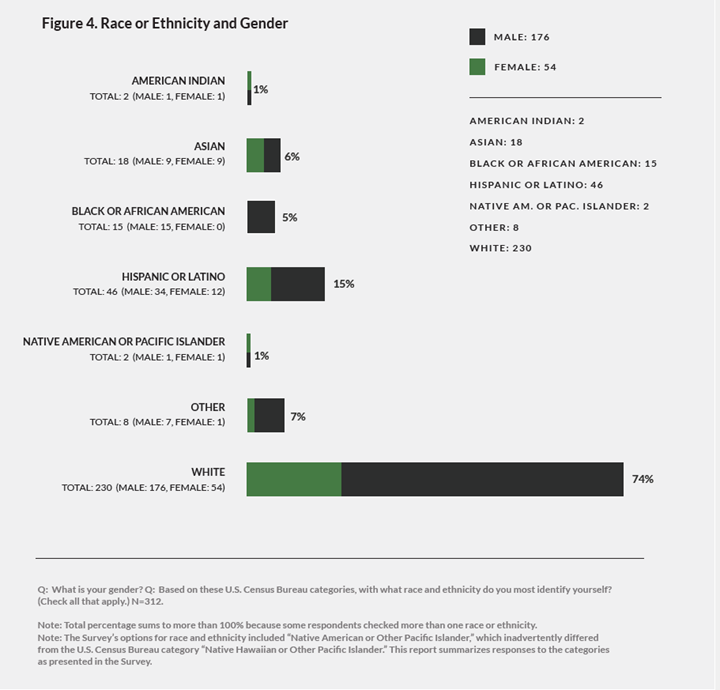
In terms of race or ethnicity, 74% are White, 15% Hispanic or Latino, 6% Asian, 5% Black or African American, 1% American Indian or Alaska Native, and 1% Native American or Pacific Islander. Another 3% identify as Other. Seven respondents identify with two races or ethnicities and one respondent with three.
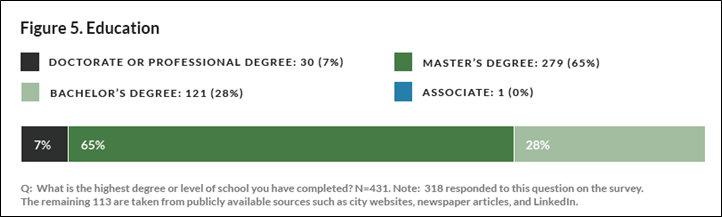
Almost all city managers for whom we were able to get education data have a Bachelor’s degree and almost three-quarters have some form of post-graduate degree. The terminal degree for just over one quarter (28%) is a Bachelor’s degree. The share of city managers with a master ’s-level degree is almost double that, 65%. Another 7% have some form of doctorate-level degree (PhD or JD).
Public policy, public administration, and business administration are the most common fields for Master’s degree holders. A law degree (JD) is the most common at the doctorate level.
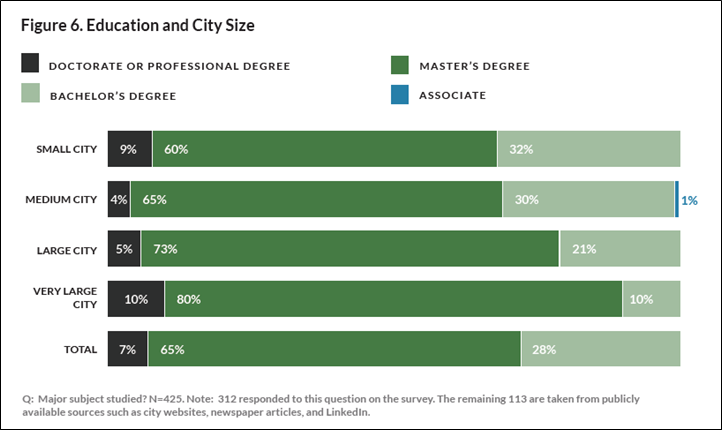
The proportion of managers with graduate-level degrees increases with the size of the city. That is, larger cities have more city managers with graduate degrees. For Small cities, 69% have a graduate degree (60% Master’s and 9% PhD or JD). For Medium Cities, the total remains the same at 69%, but the distribution is slightly different with 65% with a Master’s and 4% PhD or JD. For Large Cities, 78% have graduate degrees (73% Master’s and 5% PhD or JD). For Very Large Cities, 90% have graduate degrees (80% Master’s and 10% PhD or JD).
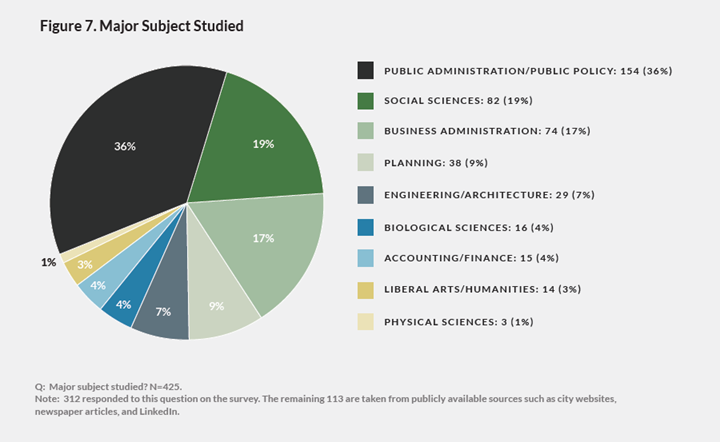
Public administration and public policy are the most common subjects of study, accounting for just over one-third (36%) of all majors. Other social science subjects account for 19%; this category includes political science, history, and law. Business administration follows closely with 17%. Planning, generally urban or regional, makes up 9%. Engineering and architecture comprise 7%, with civil engineering being the most common specialty. See Appendix C for a list of fields included in each category.
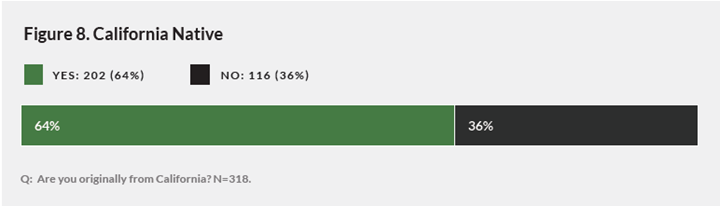
Two-thirds (64%) of responding city managers report that they are originally from California.
IV. EMPLOYMENT PROFILE
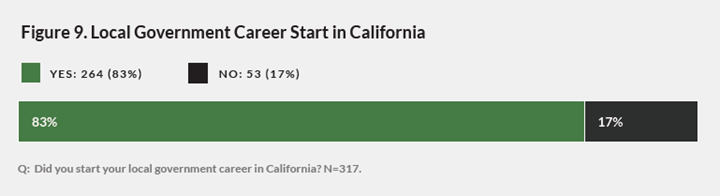
The vast majority of California city managers began their local government careers in California. Eighty-three percent got their start here and 17% began outside of California.
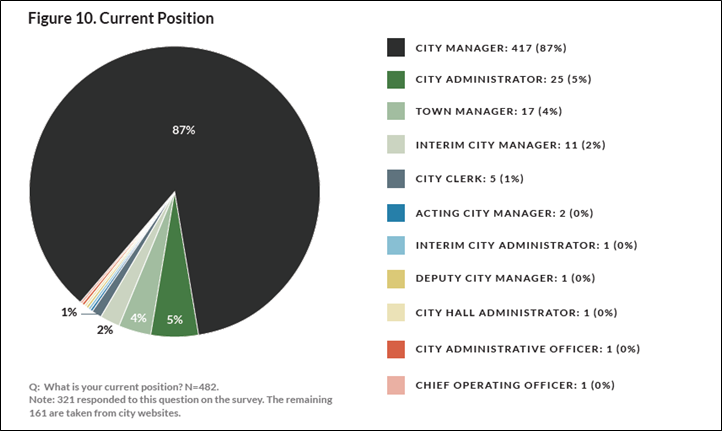
City manager is the most common title used for the chief administrative officer in the vast majority of California cities. Of the 482 cities in this study, 431 use a city manager (we include the 417 current city managers, 11 interim city managers, 2 acting city managers, and 1 deputy city manager). City administrator is the next most common title (26 cities, 5% of the total), followed by town manager (17 cities, 4% of the total).
With the exception of the five cities that have a strong mayor system of government, the city managers, city administrators, and town managers perform functionally equivalent jobs.
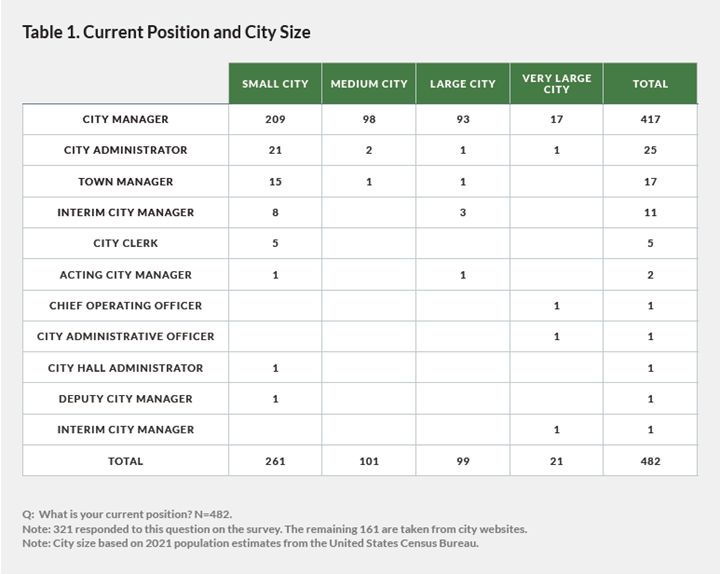
In some small cities, the city clerk acts as the administrative officer. For the five strong mayor cities in California, the elected mayor is the chief executive officer, nominally responsible for running all city departments. In all five of those cities, the mayor is, however, assisted by an appointed administrative officer. San Diego has a Chief Operating Officer, Los Angeles a Chief Administrative Officer, and Fresno a City Manager. Both San Francisco and Oakland have a City Administrator.
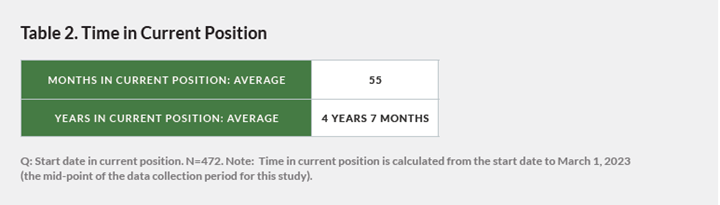
We were able to identify start dates for 472 city managers. They have been in their current positions for an average of 55 months or just over 4.5 years.
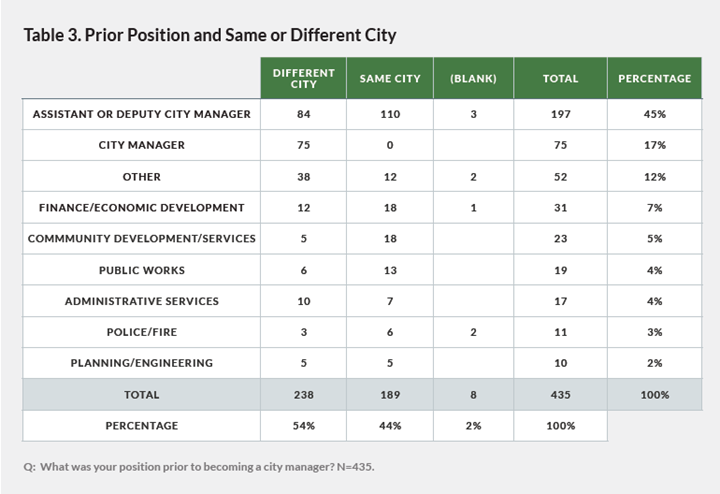
Almost half (45%) of the city managers for whom we were able to collect data, served as an assistant or deputy city manager prior to their current position. Of the 197 in that category, 110 (56%) were assistants in the same city and were promoted internally. The other 84 (44%) were assistants or deputy city managers in other cities.
Another 17% moved into their current city manager position having served as city manager for a different city. Another 12% moved to the city manager position from other municipal offices and 7% from city finance or economic development positions.
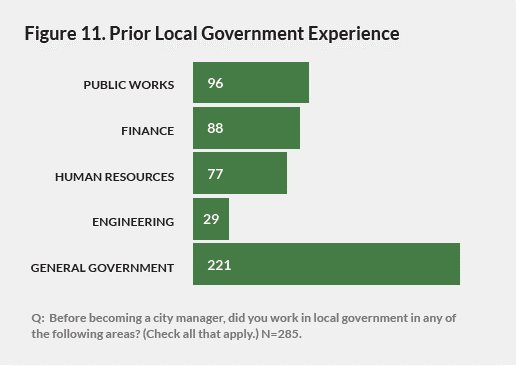
City managers bring a broad range of experience to the position. Almost one-third of respondents (96 of the 285) report having prior experience in public works, 88 of the 285 in finance, and 77 of the 285 in human resources. Approximately 10% (29 of the 285) have prior experience in engineering.
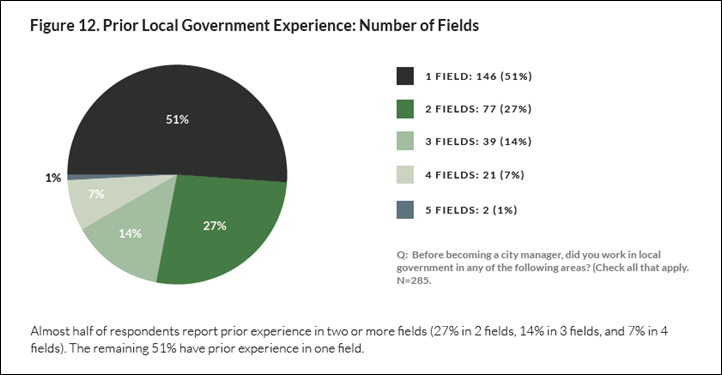
Almost half of respondents report prior experience in two or more fields (27% in 2 fields, 14% in 3 fields, and 7% in 4 fields). The remaining 51% have prior experience in one field.
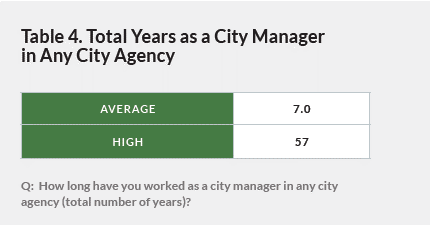
City managers responding to this question have worked an average of seven years as city managers of any city agency. Carolyn Steffan of Tehama is the longest serving, with a tenure as city clerk and city administrator that spans 57 years.[9]
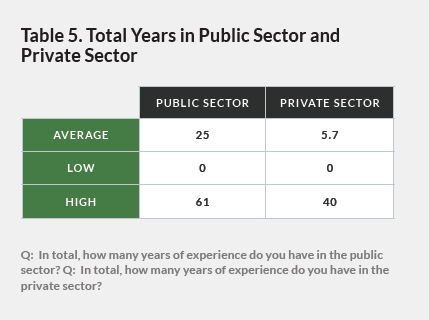
Survey respondents report an average of 25 years of experience in the public sector, with Ms. Steffan having the most experience at 61 years. Respondents report an average of 5.7 years of experience in the private sector.
VI. CITY PROFILE
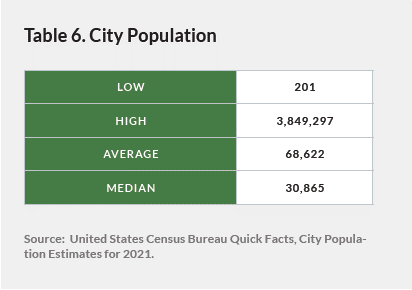
California’s 482 cities range in population from 201 (Amador) to 3,849,297 (Los Angeles). The average population is 68,822. The median population is 30,865, meaning that half of all the cities are smaller and half are larger.
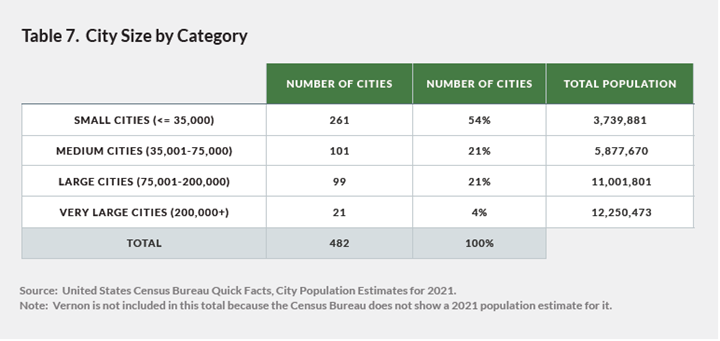
More than half (54%) of California cities are Small, with a population equal to or less than 35,000. Medium Cities, population 35,001 to 75,000, make up 21% and the average for California cities (68,622) falls within this category. Large Cities, population 75,001 to 200,000, account for another 21%. Finally, there are 21 Very Large Cities in California, with a population greater than 200,000. Although Very Large Cities are only 4% of the total number of cities in the state, they are home to 31% of California’s 39 million residents.[10]
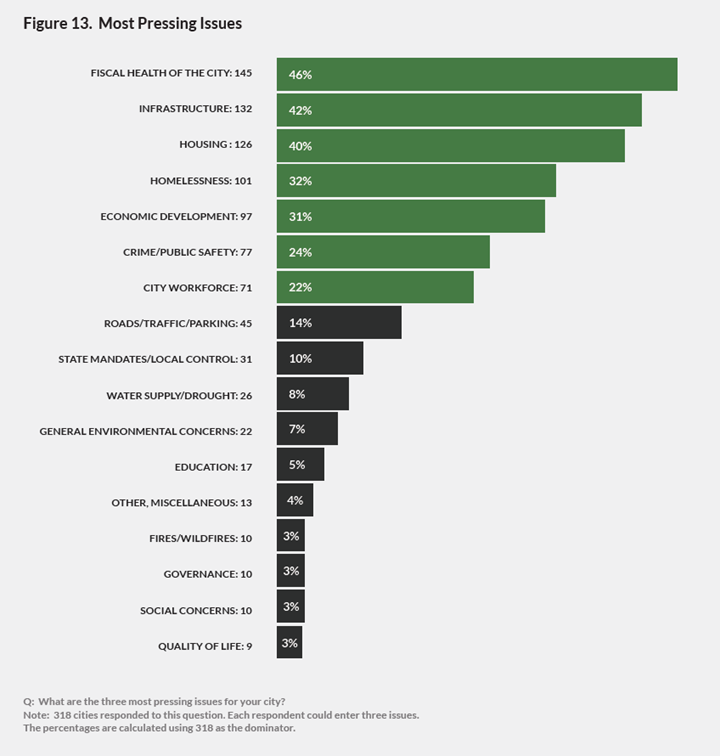
We asked city managers to identify the three most pressing issues facing their cities. Of the 318 responding to this question, almost half (46%) identified the Fiscal Health of the city as a concern. The next two highest concerns are Infrastructure (42%) and Housing (40%). Homelessness (32%) and Economic Development (31%) are the next most pressing concerns. They are followed by Crime and Public Safety (24%) and City Workforce issues (22%).
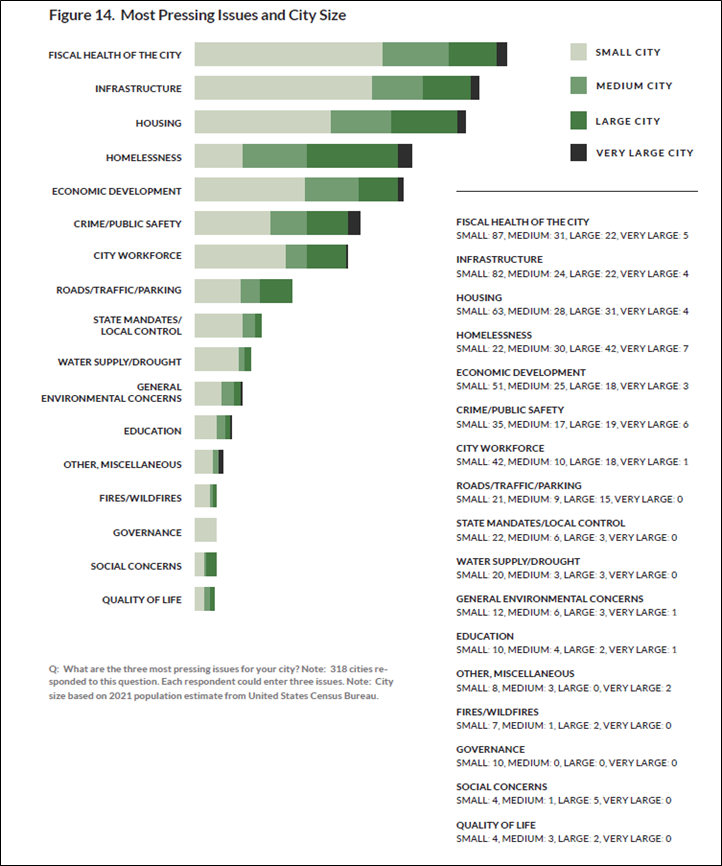
It is interesting to note that there is some variation on the three most pressing issues based on city size. The 145 cities reporting pressing concern about the Fiscal Health of the city is dominated by 87 Small Cities and 31 Medium Cities. Only 22 Large Cities and 5 Very Large Cities list Fiscal Health as one of their three most pressing concerns.
Among Large Cities, Homelessness is the top concern (cited by 42 cities), followed by Housing (31), Fiscal Health (22), and Infrastructure (22). Homelessness was also the top concern for Very Large Cities (7), followed by Crime/Public Safety (6) and Fiscal Health (5).
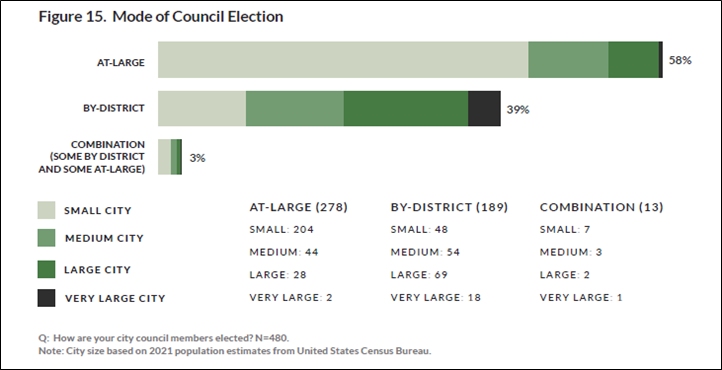
Almost two-thirds of California cities elect councils with representatives chosen at-large (that is, representing the entire city). For 39% of California cities councils are elected to represent individual districts. Another 3% use a mixed system with some members elected by-districts and some at-large. However, 11 of the 13 cities currently using a combination system are doing so as part of the process of transitioning from at-large systems to by-district. All 11 will be fully by-district in the 2024 election cycle.
By-district or combination councils are increasingly common in larger cities. Among Small Cities, only 48 of the 258 have by-district or combination councils. In contrast, all the other categories have more cities that elect councils by-district than at-large. Fifty-seven of the 101 Medium Cities elect councils by-district or using a combination system, as do 71 of the 99 Large Cities. Eighteen of the 21 Very Large Cities use a by-district system to elect their city councils.
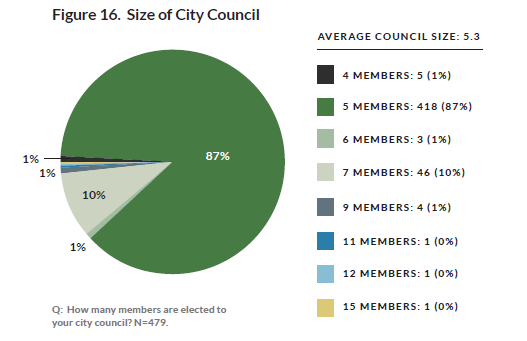
The 5-member city council is the default under California law[11] and the vast majority (87%) of city councils in California are that size. Charter cities have the authority to deviate from the default as part of their charter. Los Angeles has the largest city council with 15 members.
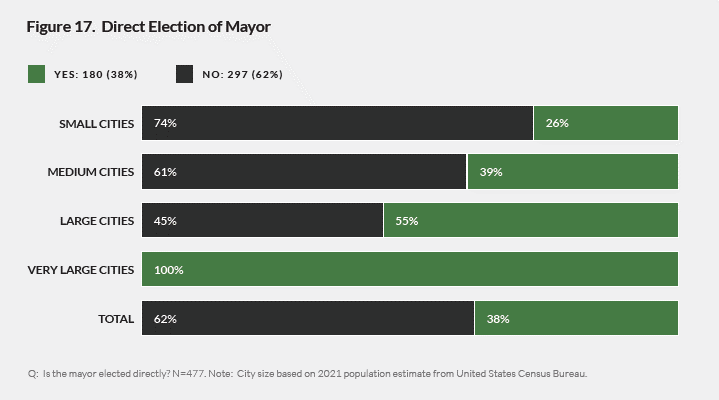
Just over one-third (38%) of the cities in California elect a mayor directly; 62% do not. Direct election is more common in larger cities. Among Small Cities, only 26% directly elect their mayor. This rises to 39% for Medium Cities and 55% for Large Cities. All Very Large Cities in California directly elect mayors.
VII. CONCLUSION
California’s city managers are a highly accomplished group. All of those in our study have some level of college education and over 70% have post-graduate degrees. They bring a wealth of experience to their work, an average of 25 years of experience in the public sector and 5.7 in the private sector. Almost half were promoted to their current city manager position after serving as the assistant or deputy city manager.
___________________
[1] Haven A. Mason, “A Profession of Municipal Management,” California Municipalities, August 1899, reprinted in Richard J. Stillman II, The Rise of the City Manager: A Public Professional in Local Government. Albuquerque: University of New Mexico Press, 1974): 117-119.
[2] Stillman, The Rise of the City Manager, 14; Randy H. Hamilton, “Ukiah, 1904: A Modest Footnote to the History of the Council-Manager Form of Municipal Government in the United States,” Berkeley, CA: U.C. Berkeley Institute of Governmental Studies Working Paper 89-2, March 1989: 1-8.
[3] John C. Bollens, Appointed Executive Local Government, Los Angeles: Haynes Foundation, 1952, 1.
[4] Stillman, The Rise of the City Manager, 19, 114.
[5] “San Diego has a Chief Operating Officer, Los Angeles a Chief Administrative Officer, and Fresno a City Manager. Both San Francisco and Oakland have a City Administrator.”
[6] Nicolas Heidorn, California Municipal Democracy Index 2016, Sacramento, CA: California Common Cause, 2016, 3, https://www.commoncause.org/wp-content/uploads/legacy/states/california/research-and-reports/california-municipal-key-findings.pdf. California state law authorizes the use of the city manager system. See Cal. Gov. Code § 34851 (2022). https://leginfo.legislature.ca.gov/faces/codes_displayText.xhtml?lawCode=GOV&division=2.&title=4.&part=1.&chapter=4.&article=1.
[7] International City/County Management Association. 2018 Municipal Form of Government Survey – Summary of Survey Results. Washington, DC: ICMA, 2019, 1, https://icma.org/sites/default/files/2018%20Municipal%20Form%20of%20Government%20Survey%20Report.pdf.
[8] See Pamela W. Antil, Tamara Letourneau, and Amber Cameron, ICMA Task Force on Women in the Profession: Final Report on the Status of Women in the Profession, Washington, DC: ICMA, August 2014, (including the 1976 Report as an appendix), https://icma.org/documents/final-report-status-women-profession; International City/County Management Association, “Data on ICMA Women in the Profession: As of June 2021,” https://icma.org/documents/data-icma-women-profession.
[9] Rich Greene. “Carolyn Steffan Honored for 50 Years of Dedicated Service.” Red Bluff Daily News, April 11, 2015, updated May 16, 2018. https://www.redbluffdailynews.com/2015/04/11/carolyn-steffan-honored-for-50-years-of-dedicated-service/.
[10] 39,029,342, U.S. Census Bureau. “Population Estimates, July 1, 2022 (V2022).” Quick Facts. Accessed May 23, 2023. https://www.census.gov/quickfacts/fact/table/CA,US/PST045222.
[11] CA Govt Code § 36501 (2022). https://leginfo.legislature.ca.gov/faces/codes_displaySection.xhtml?sectionNum=36501.&lawCode=GOV.
REFERENCES
Bollens, John C. Appointed Executive Local Government, Los Angeles: Haynes Foundation, 1952, 1.
Cal. Gov. Code § 34851 (2022) https://leginfo.legislature.ca.gov/faces/codes_displayText.xhtml?lawCode=GOV&division=2.&title=4.&part=1.&chapter=4.&article=1.
Cal. Gov. Code § 36501 (2022). https://leginfo.legislature.ca.gov/faces/codes_displaySection.xhtml?section-Num=36501.&lawCode=GOV.
Greene, Rich. “Carolyn Steffan Honored for 50 Years of Dedicated Service.” Red Bluff Daily News, April 11, 2015, updated May 16, 2018. https://www.redbluffdailynews.com/2015/04/11/carolyn-steffan-honored-for-50-years-of-dedicated-service/.
Hamilton, Randy H. “Ukiah, 1904: A Modest Footnote to the History of the Council-Manager Form of Municipal Government in the United States,” Berkeley, CA: U.C. Berkeley Institute of Governmental Studies Working Paper 89-2, March 1989: 1-8.
Heidorn, Nicolas. California Municipal Democracy Index 2016. Sacramento, CA: California Common Cause. December 2016. https://www.commoncause.org/wp-content/uploads/legacy/states/california/research-and-reports/california-municipal-key-findings.pdf.
International City/County Management Association. 2018 Municipal Form of Government Survey – Summary of Survey
Results. Washington, DC: ICMA, 2019, 1, https://icma.org/sites/default/files/2018%20Municipal%20Form%20of%20Government%20Survey%20Report.pdf.
Mason, Haven A. “A Profession of Municipal Management,” California Municipalities, August 1899, reprinted in Richard J. Stillman II, The Rise of the City Manager: A Public Professional in Local Government. Albuquerque: University of New Mexico Press, 1974: 117-119.
Stillman, Richard J., II. The Rise of the City Manager: A Public Professional in Local Government. Albuquerque: University of New Mexico Press, 1974): 117-119.
U.S. Census Bureau. “Population Estimates, July 1, 2021 (V2021),” Quick Facts. Accessed March 1, 2023 – April 10, 2023. https://www.census.gov/quickfacts/fact/table/US/PST045222.
U.S. Census Bureau. “Population Estimates, July 1, 2022 (V2022).” Quick Facts. Accessed May 23, 2023. https://www.census.gov/quickfacts/fact/table/CA,US/PST045222.