
By Alex D.L. Bentley ’13
The twenty-third decennial United States Census, conducted in 2010 and released this past spring, provided up-to-date demographic data for the nation in categories including population, race, age, and sex. This data is used to determine the number of seats each state has in the United States House of Representatives and drives the allocation of much federal funding.
 Census numbers revealed disappointingly low population growth for the state of California over the course of the past decade. With a population increase of 10.0 percent (4.5 million residents) since 2000, California barely managed to beat the national average of 9.7 percent. This marks the first time California did not gain a seat in the U.S. House of Representatives. The growth that occurred reflects a shift strongly inland from the coast, threatening to pull political power away from the traditional strongholds of San Francisco and Los Angeles.
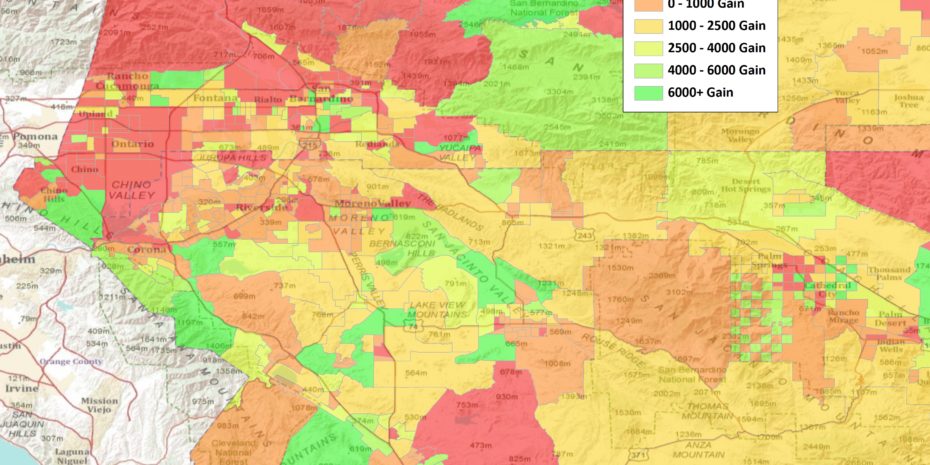
California’s slow growth stands in sharp contrast to the Inland Empire’s robust expansion. Made up of San Bernardino and Riverside counties, the Inland Empire has seen considerable growth over the past decade. According to the 2010 Census, Riverside County’s population grew by an impressive 42 percent while San Bernardino County grew by nearly 20 percent. This growth brought the Empire’s total population to 4.2 million, a 30 percent increase over 2000. Even with Riverside County’s explosive gain of 42 percent, it failed to place near the top of the nation’s rankings for the fastest growing regions. The nation’s fastest growing counties were strongly concentrated in the southern United States and frequently reported population increases higher than 50 percent. Kendall County, Illinois, was the fastest growing county in the country and is the exception that proves the rule. It is located in northeastern Illinois (in the Chicago region) and saw its population increase by 110.4 percent in the last decade. Riverside County just makes the top 70 on the list of the decade’s fastest growing counties, placing 69th.
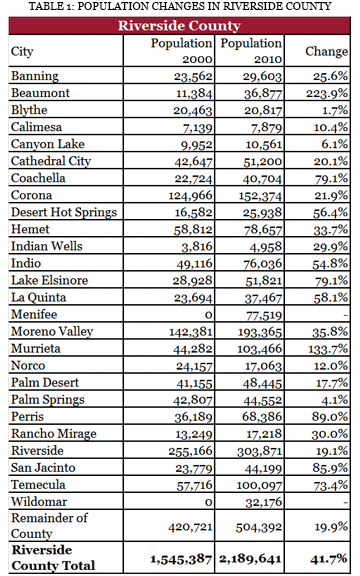
The population of Riverside County grew from 1,545,387 in 2000 to 2,189,641 in 2010, with most of the rapidly expanding cities along freeway corridors. On the 10 Freeway, Beaumont led with a 223.9 percent increase, with San Jacinto (85 percent) and Coachella (79.1 percent) also showing large gains. Murrieta (133.7 percent) and Perris (89 percent), on the 215 Freeway corridor, also had big population increases. Lake Elsinore (79.1 percent), and Temecula (73 percent) led the growth along the 15 Freeway.
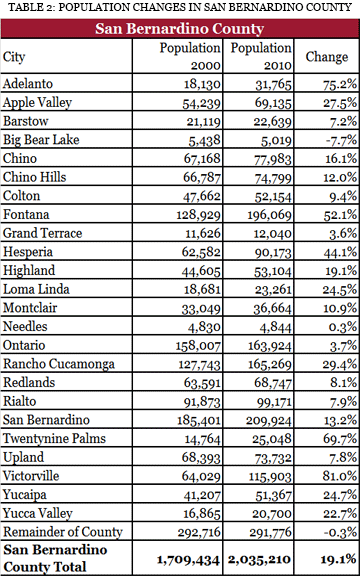 In San Bernardino County the Victorville area was the center of significant growth. Victorville’s population increased by 81 percent, Adelanto’s by 75.2 percent, and Hesperia’s by 44.1 percent. Twentynine Palms grew by 69.7 percent, driven by increased military activity. Closer to Los Angeles, Fontana (52.1 percent) and Rancho Cucamonga (29 percent) both grew substantially.
As expected, the Hispanic population throughout the Inland Empire grew substantially while Caucasian numbers remained fairly steady, thus decreasing in the percentages. Hispanics now make up 49 percent of San Bernardino County and 46 percent of Riverside County, much higher than California’s statewide total of 38 percent, and the national average of 16.3 percent. African Americans now make up 7.6 percent of the Inland Empire while Asians make up 6.2 percent.
With substantial population growth came new and more inclusive district boundaries for the Inland Empire. These lines, drawn by the California Redistricting Commission (CRC), are a considerably shift from those of 2001. In 2001 the region’s Congressional representation was split, with western portions San Bernardino County placed in districts with Los Angeles County, and western Riverside County sharing districts with Orange and San Diego Counties. The CRC has adopted districts that stay almost entirely in the Inland Empire plus Pomona (Pomona-Ontario-Fontana, Redlands-San Bernardino-Rancho Cucamonga, Riverside-Moreno Valley-Perris, and so on). See New Maps, Big Changes for the Inland Empire in this issue for a detailed analysis of California’s new congressional districts.
State Senate and Assembly lines have also undergone changes, although not to the same degree. Key shifts in the state Senate include placing eastern areas of the City of San Bernardino in a Rancho Cucamonga-Lake Arrowhead-Highland-Redlands-Hemet-Menifee district, and the placement of Riverside-Corona-Moreno Valley into a single “Northwest Riverside County” district. The assembly lines maintain the Pomona-Ontario and Fontana-west San Bernardino districts. The 2001 Yucaipa – Apple Valley – Claremont – Glendale 59th District has been replaced with a district that appears only slightly less geographically creative as it climbs Mount San Antonio to link Rancho Cucamonga with east San Bernardino and Redlands. The Coachella Valley is divided between Assembly Districts, placing Indio/Coachella and Desert Hot Springs with Imperial County and the rest with San Jacinto, Banning and Twentynine Palms. The San Jacinto/Hemet area is split three ways: San Jacinto with most of the Coachella Valley; East Hemet with Wildomar and Murietta, and Valley Vista with eastern San Diego County. The CRC’s maps are finished but face legal and referendum challenges.
Sorry, comments are closed for this post.